Chlorothalonil Environmental Exposures

Chlorothalonil Environmental Exposures
Overview
The general population is exposed to chlorothalonil through their diet (residues on foods or drinking water), direct skin contact, or inhalation as a result of application.[1,2]
CAREX Canada has developed several estimates of exposure to chlorothalonil, including maps of agricultural chlorothalonil use and the number of people potentially exposed in nearby residential areas (circa 2016). We also offer lifetime excess cancer risk (LECR) estimates (circa 2011), which are distinct from the potential exposure estimates.
CAREX Canada estimates that over 1.5 million people in Canada live in areas where the potential for exposure to chlorothalonil is higher than other areas in the country based on their residential proximity to agricultural areas, which amounts to about 5% of the Canadian population.
READ MORE...
Since people residing near agricultural land may have higher pesticide exposures than those who live in non-agricultural areas due to the geographical proximity to areas with high pesticide usage, these estimates focus on community exposure related to agricultural pesticide use.[3,4] In addition, data availability for other routes of exposure (e.g. diet, domestic application) are limited. As expected, exposure varies based on agricultural activity and the types of crops grown. Potential exposure to chlorothalonil is much higher in areas where root crops such as potatoes, or fruits were more commonly grown. Southern British Columbia, Prince Edward Island, Saskatchewan, and Southern Quebec all have higher potential for exposure to chlorothalonil than other areas of the country.
The LECR estimates show that average exposure to chlorothalonil in outdoor air does not result in an increased risk of cancer (moderate to very low data quality). However, risks related to above average exposure are unknown.
Chlorothalonil is strongly adsorbed to suspended matter in water and may biodegrade. It is rapidly degraded in soil and does not bioaccumulate in mammals.[5] The amount of chlorothalonil residue on foods depends on application rate, time interval between application and harvest, and type of crop.[5] CAREX Canada estimates that chlorothalonil in foods and beverages does not result in an increased risk of cancer (very low data quality).
The Canadian Food Inspection Agency (CFIA) monitors the Canadian food supply for chemical residues and contaminants in order to ensure they are compliant with maximum residue limits (MRLs) and other tolerances established by Health Canada. Between 2015-2016, the CFIA sampled 1,690 samples of domestic fresh fruit and vegetables as part of the National Chemical Residue Monitoring Program. Of the 1,690 samples, there were 5 violations of the MRLs, which corresponds to a compliance rate of 99.7%.[6] Risk of exposure via ingestion can be decreased through preparation activities such as washing, peeling, and cooking foods.[5]
Mapping potential exposure
Although average exposure to chlorothalonil does not relate to a higher cancer risk in outdoor air, the amount of pesticides that individuals are potentially exposed to does vary widely across the nation. Pesticide usage for all crops in Canada (circa 2016) were used to estimate the total amount of chlorothalonil applied to crops which indicates potential exposure for people living in nearby areas. Actual pesticide application rates were not available for Canada, so pesticide usage was estimated based on crop types grown and typical application rates for these crops in North America.
Results show that potential for chlorothalonil exposure is much higher in areas where root crops (e.g. potatoes) and fruits are more commonly grown. Southern British Columbia, Prince Edward Island, Southern Quebec, and parts of the Saskatchewan all have higher potential for chlorothalonil exposure than other areas of the country.
Chlorothalonil usage in Canada based on all available agricultural crops, 2016 †

*Estimated agricultural application rates of less than 0.2 kg/km2 are classified as no exposure
Potential number of people exposed
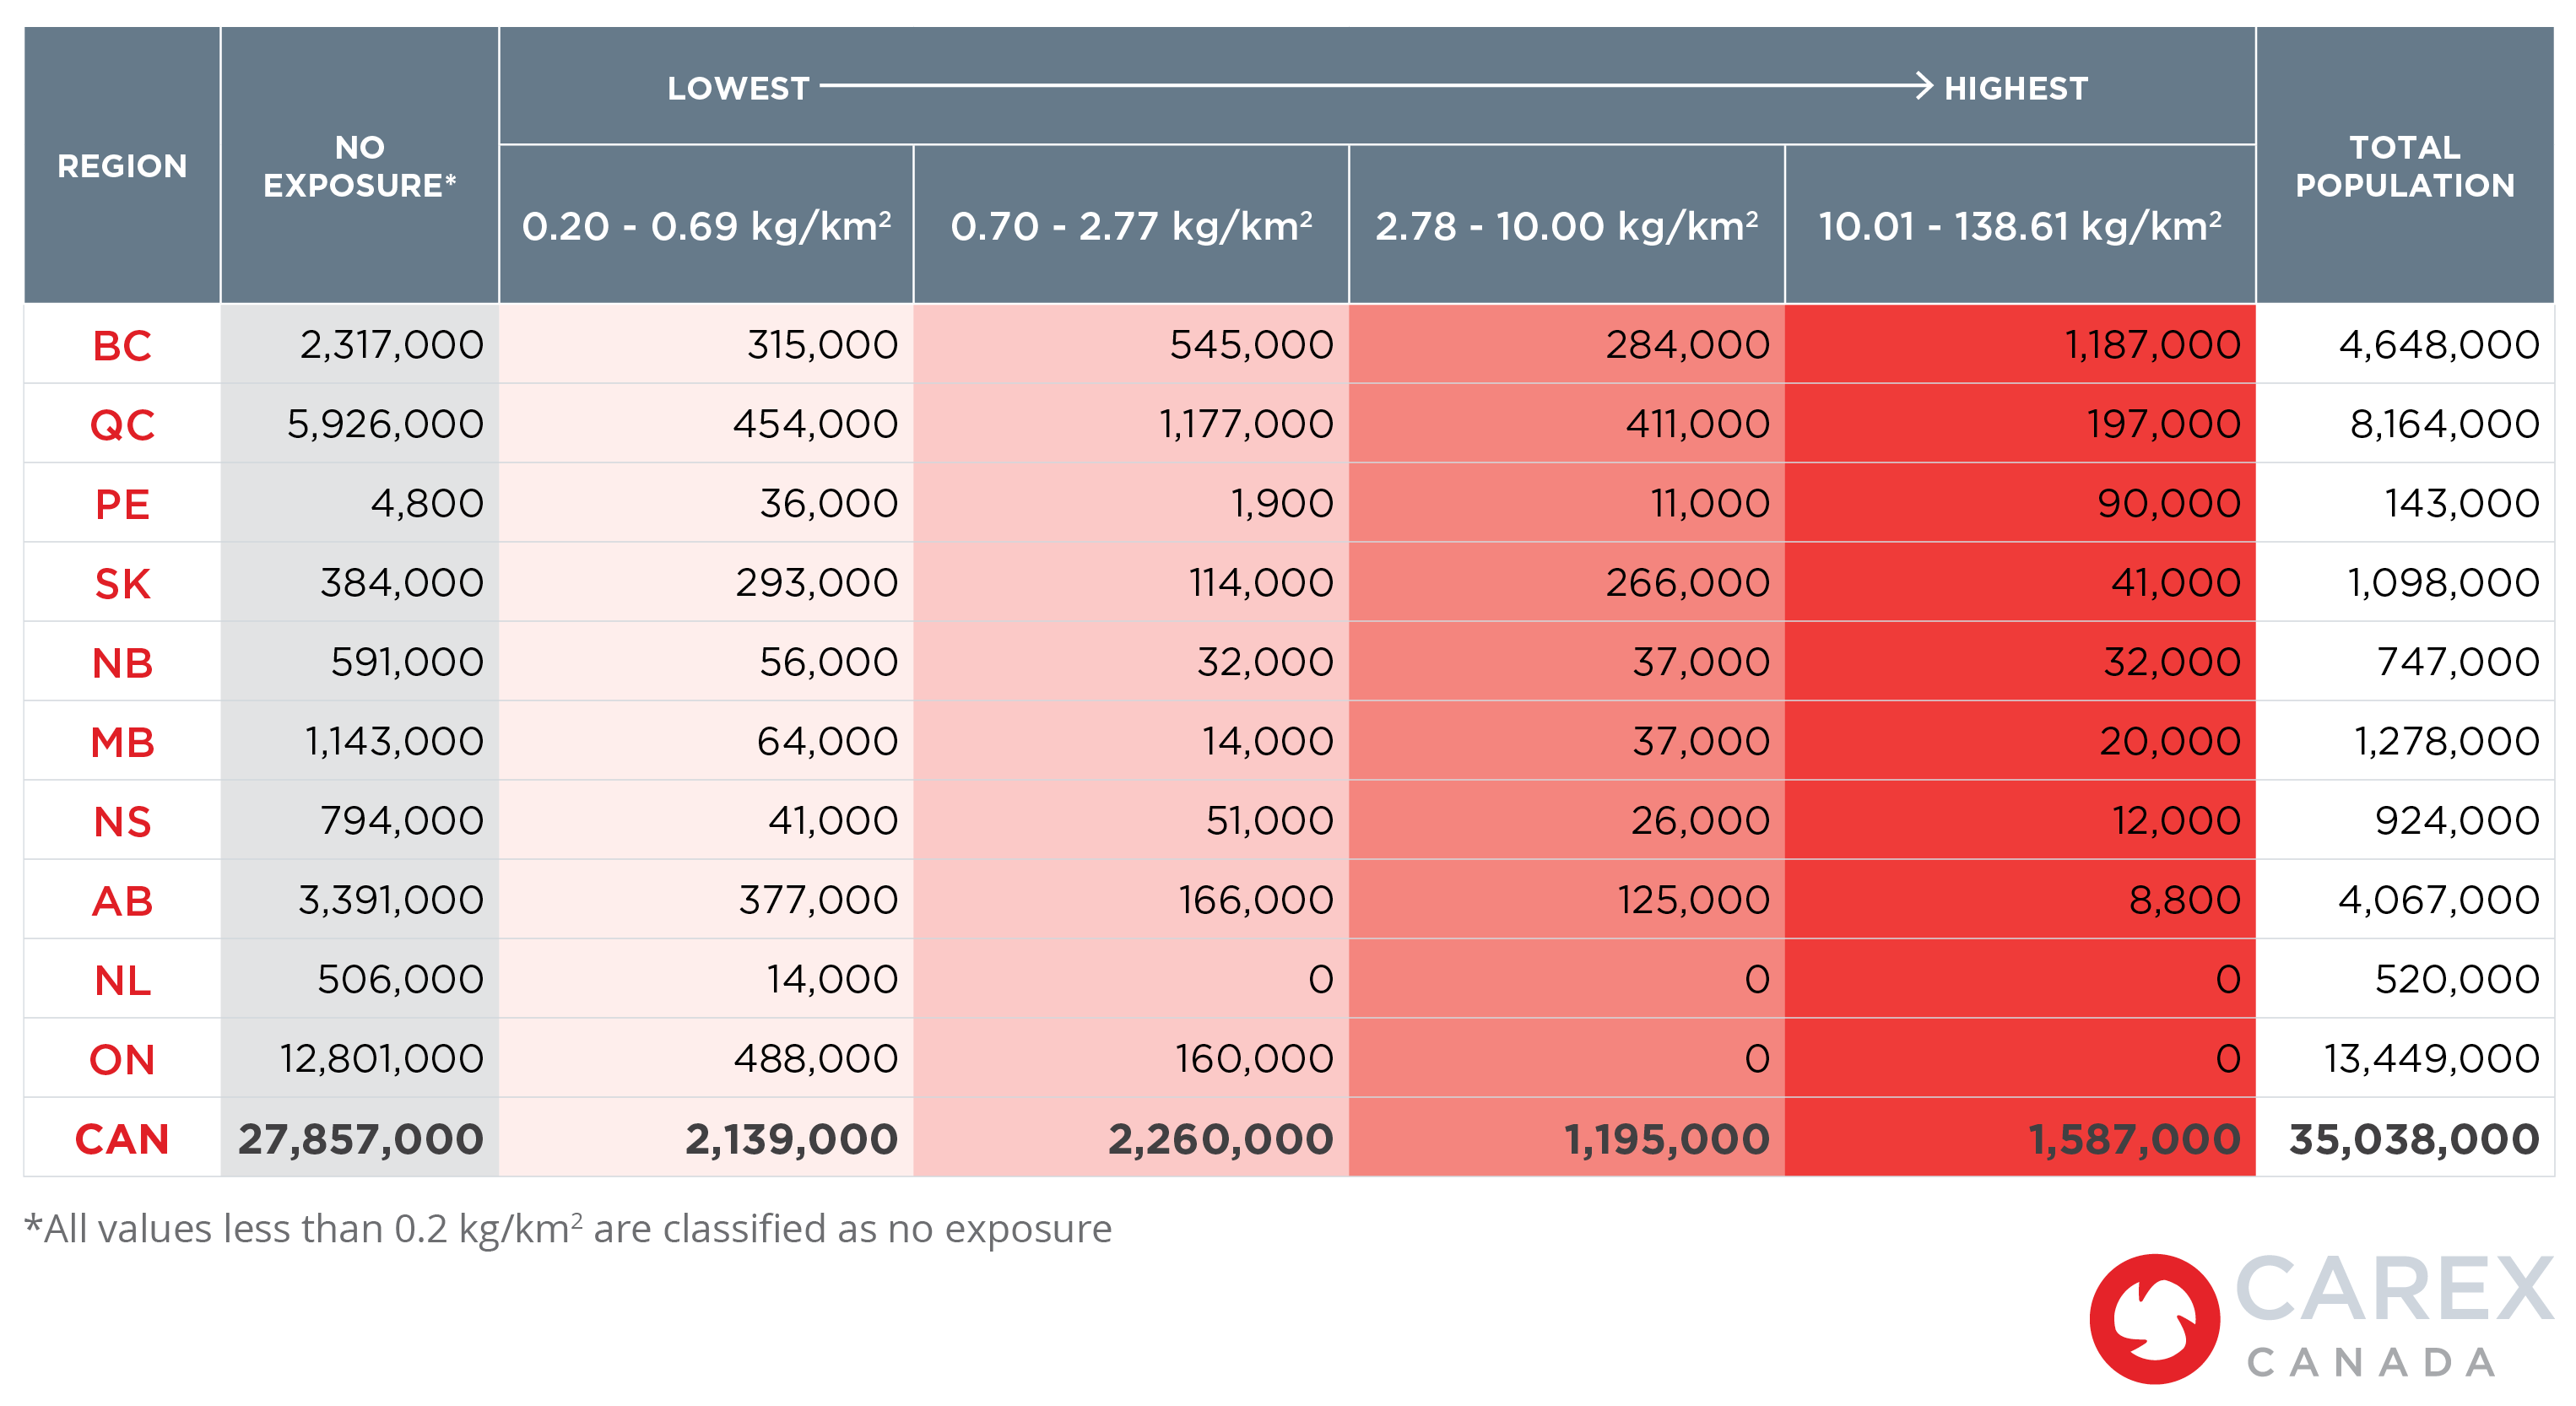
Over 1.5 million people in Canada live in areas where the potential for exposure to chlorothalonil is higher than other areas in the country, which amounts to about 5% of the Canadian population. As displayed in the figures below, exposure levels vary by province, mostly due to differences in agricultural activity and population densities. More people are likely to be exposed in agricultural areas with high population density, while areas with intensive agricultural activity and lower population density will see relatively lower numbers but a higher percentage of their population exposed. For example, Prince Edward Island has the highest percentage of their population living in areas with above average potential for exposure, with 90,000 of the 143,000 people living in the province (63%) estimated to be in the highest category. This is likely due to a higher number of potato farms but lower population density within the province. As expected, regions where crops such as fruits and potatoes are less commonly grown have much lower estimated exposures.
Percent of people potentially exposed to chlorothalonil based on application rates (kg/km2) by province, 2016†
[
* Estimated agricultural application rates of less than 0.2kg/km2 are classified as no exposure
On the other hand, British Columbia has the largest number of people living in areas with the highest potential for exposure (1,187,000 people). This is likely due to the abundance of fruit farms in the province and relatively high population density in nearby areas.
Number of people potentially exposed to chlorothalonil based on application rates (kg/km2) by province, 2016†
†Note: Results illustrate chlorothalonil application rates in kilograms per square kilometre (kg/km2) for each Census Sub-Division (CSD) in Canada (n=5,054). Data were mapped in quartiles to show variations in application rates across the country and do not represent an associated risk or exposure limit. The potential for exposure is higher in areas with higher application rates, but this does not necessarily indicate that exposure has occurred.
Cancer Risk Estimates
Potential lifetime excess cancer risk (LECR) is an indicator of Canadians’ exposure to known or suspected carcinogens in the environment. When potential LECR is more than 1 per million in a single pathway, a more detailed risk assessment may be useful for confirming the need to reduce individual exposure. If measured levels of chlorothalonil in relevant exposure pathways (outdoor air, indoor air, indoor dust, drinking water, and food and beverages) decrease, the risk will also decrease.
Potential LECR is calculated by multiplying lifetime average daily intake (the amount inhaled or ingested) by a cancer potency factor or unit risk factor. More than one cancer potency factor may be available, because agencies interpret the underlying health studies differently, or use a more precautionary approach. Our results use cancer potency factors from Health Canada, the US Environmental Protection Agency (US EPA), and/or the California Office of Environmental Health Hazard Assessment (OEHHA).
The calculated lifetime daily intake and LECR results for chlorothalonil (circa 2011) are provided in the tables below. These estimates are distinct from the potential exposure map and population estimates above. For more information on supporting data and sources, click on the Methods and Data tab below.
Calculated Lifetime Daily Intake, 2011
Lifetime Excess Cancer Risk (per million people), 2011
*LECR based on average intake x cancer potency factor from each agency
Potential LECR assumes exposure occurs at the same level, 24 hours per day, for 70 years. This is rarely true for any single individual, but using a standard set of assumptions allows us to provide a relative ranking for known and suspected carcinogens across different exposure routes. While ongoing research continually provides new evidence about cancer potency and whether there is a safe threshold of exposure, our approach assumes there are no safe exposure levels.
Methods and Data
Methods and data for potential exposure estimates
Data sources
Actual pesticide application rates were not available for Canada, so pesticide usage was estimated based on crop types grown and typical application rates for these crops in North America. To estimate potential environmental exposure for chlorothalonil, data were obtained on the distribution and acreage of different crop types, chlorothalonil application rates and the population or number of people living in each area. Data on agricultural crops were obtained from Agriculture and Agri-Food Canada’s Annual Crop Inventory for 2016, which are digital images (raster datasets) that produce an average crop accuracy of 89%.
Data on pesticide usage came from the United States Department of Agriculture’s Agricultural Chemical Use Program and the Government of Ontario’s Ministry of Agricultural, Food and Rural Affairs. These datasets summarize how much chlorothalonil was applied to crops along with the average yearly application rates. Group averages were applied if specific crop data were not available. For instance, we averaged the chlorothalonil application rates for pears, peaches, and apples to estimate the application rate for “orchard fruits”, which was a crop type captured by the Annual Crop Inventory. Average annual chlorothalonil application rates for all crops were obtained.
Population data from Canada’s 2016 Census of Population were used to estimate the number of people potentially exposed. Population estimates are based on the number of people living within the census subdivision (CSD).
Methods and analysis
Estimates were calculated at the CSD level (n=5,054). Specifically, we calculated the total area (in km2) of land within each CSD for each crop type. Total areas were then multiplied by the average chlorothalonil application rate data for each crop. Finally, the total was summed together to obtain an estimate of chlorothalonil use in kilograms for each CSD. Results were weighted in square kilometres to illustrate the kilograms of chlorothalonil applied per square kilometre in each CSD. CSDs with less than 0.2 kg/km2 were classified as having no exposure to account for very small agricultural activity within the CSD. Data are presented in quartiles and integrated with population data to show potential exposure and variation across the country.
Methods and data for lifetime excess cancer risk (LECR) estimates
Our Environmental Approach page outlines the general approach used to calculate lifetime excess cancer risk estimates.
Data sources and data quality for chlorothalonil LECR estimates can be found in the PDF below.
Sources
Subscribe to our newsletters
The CAREX Canada team offers two regular newsletters: the biannual e-Bulletin summarizing information on upcoming webinars, new publications, and updates to estimates and tools; and the monthly Carcinogens in the News, a digest of media articles, government reports, and academic literature related to the carcinogens we’ve classified as important for surveillance in Canada. Sign up for one or both of these newsletters below.
CAREX Canada
School of Population and Public Health
University of British Columbia
Vancouver Campus
370A - 2206 East Mall
Vancouver, BC V6T 1Z3
CANADA

As a national organization, our work extends across borders into many Indigenous lands throughout Canada. We gratefully acknowledge that our host institution, the University of British Columbia Point Grey campus, is located on the traditional, ancestral, and unceded territories of the xʷməθkʷəy̓əm (Musqueam) people.