Night Shift Work Occupational Exposures

Night Shift Work Occupational Exposures
Overview
CAREX Canada estimates that approximately 1.8 million Canadians work shifts between midnight and 5am. This represents around 12% of working Canadians. Industries with the most night shift workers include trades, health care and social assistance, manufacturing, and accommodation and food services.
Read more...
According to the Burden of Occupational Cancer in Canada project, night shift work leads to approximately 470 to 1,200 suspected breast cancers in women each year, based on past exposures (1961-2001).[1,2,3] This amounts to 2 to 5% of all female breast cancers diagnosed annually. These results are shown as a range because research studies are not in agreement on the impact of night shift work on breast cancer risk. Most occupational breast cancers in women associated with night shift work occur among workers in the health care. These cancers also occur among workers in the accommodation and food services, trade, and manufacturing sectors.
Prevalence Estimate
CAREX considers exposure to shift work as working outside of a typical workday (i.e. 9am to 5pm). However, since the strongest evidence for cancer risk comes from studies of workers who work regular night shifts and rotating shifts, we only include these in our total reported number of workers exposed. In total, approximately 12% of working Canadians worked a regular night or rotating shift schedule in 2011. This amounts to approximately 1.8 million workers. The largest proportion of regular night and rotating shift workers are found in Newfoundland and Labrador (18%), Nova Scotia (16%) and New Brunswick (16%). The total number of workers on regular night or rotating shifts decreased by approximately 100,000 from 2006 to 2011.
Work schedule type breakdown by region in 2011
Exposed = regular night or rotating shift
Possibly exposed = regular evening, split shift, on call, irregular schedule, or other
Unexposed = regular day
Industry groups with the greatest numbers of people working regular night or rotating shifts are Trade (n=396,000; 15% of industry), Health Care and Social Assistance (n=318,000; 18% of industry), and Manufacturing (n=261,000; 17% of industry). The top three industries have remained constant from 2006 to 2011, but the relative order has changed; in 2006, the manufacturing industry had the highest number of workers on regular night or rotating shifts (n=419,000; 21% of industry) followed by Trade, and then Health Care and Social Assistance.
Breaking down these results by sex across industry sectors, Health Care and Social Assistance, Trade, and Accommodation and Food Services are predominantly composed of women, while Manufacturing and Public Administration are predominantly composed of men.
Number of male and female workers in top night shift work* industries in 2011
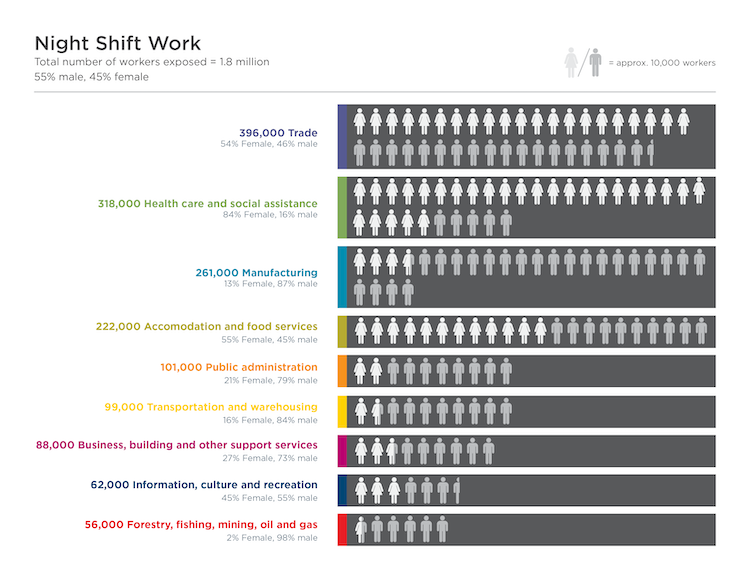
*Defined as working a regular night or a rotating shift
Level of Exposure
In total, approximately 1.8 million Canadians worked regular night or rotating shifts in 2011. These workers are considered exposed. Approximately 3.4 million workers have a low potential for exposure (i.e. they work regular evening, split shift, on call, irregular schedule, or other) and are categorized as possibly exposed. Workers in the possibly exposed group are not included in the total exposed. The majority of workers in Canada (n=10.1 million) work a regular daytime schedule and are considered unexposed.
Workers exposed to night shift work by exposure level in 2011
Exposed = regular night or rotating shift
Possibly exposed = regular evening, split shift, on call, irregular schedule, or other
Unexposed = regular day
Level of exposure by industry
Identifying industries with highest numbers of workers exposed to night shift work is an important step for informing cancer prevention efforts. This information can help to prioritize exposed groups and target exposure reduction resources more effectively.
The table below shows the number of workers exposed by industry group and level of exposure to shift work. These results highlight industries with the greatest number of workers, as well as the industries with the highest proportion of workers in the exposed category. Data is shown for those industry groups with at least 50,000 people in the exposed category (i.e. known night shift workers).
For example, the highest prevalence of exposure is found in the Trade industry group (396,000; 15% of workers in that industry), while the highest proportion is found in the Accommodation and Food Services industry, with nearly 20% of workers exposed in that industry.
Workers exposed to night shift work by exposure level and industry in 2011
Exposed = regular night or rotating shift
Possibly exposed = regular evening, split shift, on call, irregular schedule, or other
Unexposed = regular day
*Numbers may not add up due to rounding
Methods and Data
Our Occupational Approach page outlines the general approach used to calculate prevalence and exposure level estimates for workplace exposures.
Data Sources
Data used in developing the occupational estimates for night shift work were collected from several sources:
- The Survey of Labour and Income Dynamics (SLID) is a longitudinal survey issued by Statistics Canada since 1993. It is comprised of people drawn from the Labour Force Survey, excluding residents of Yukon, Northwest Territories, Nunavut, residents of institutions, and persons living on First Nations reserves. Data consists of the Canadian working population, aged 16-69, with a paid job during the reference year. The survey follows panels of approximately 17,000 households for six years, with a new panel being introduced every three years, resulting in two panels overlapping in any given year. For our estimates on night shift work exposure, we used the SLID from the year 2011.
- Canadian, US, and European scientific peer-reviewed publications that addressed night shift work definitions and exposure.
- Grey literature including technical reports from governments and international bodies.
Prevalence Estimate Method
Shift work can be defined as the organization of working time by different teams in succession to cover more than the usual 8-hour work day, up to a 24 hour period. The International Agency for Research on Cancer (IARC) has concluded that “shift-work that involves circadian disruption is probably carcinogenic to humans, Group 2A.” CAREX considers exposure to shift work as working outside of a typical workday (i.e. 9am to 5pm). However, since the strongest evidence for cancer risk comes from studies of workers who work regular night shifts and rotating shifts, we only include these in our total reported number of workers at risk of exposure. We also include a “possibly exposed” category of mixed shift types where evidence is less clear.
For all of our reported night shift work estimates, we used the SLID 2011 data (using cross-sectional weights for extrapolation to national figures) only for those respondents with complete data reported on industry, occupation, province, and shift type. This allows the most flexibility and consistency with our reported values, especially when using several dimensions of the data. This approach slightly underestimates the number of night shift workers in Canada, and this is addressed below in the section titled “Underestimation of night shift work prevalence”.
Exposure Level Method
To create exposure level categories by industry and sex, CAREX used data obtained from the 2011 Survey of Labour and Income Dynamic (SLID) and available literature and reports. Based on IARC’s conclusion that shift work involving circadian disruption is of highest concern, CAREX has classified exposure levels to shift work according to potential for circadian disruption. These categories are:
Category 1: Unexposed
A group of workers (people in the same job category and industry) is put in this exposure category if they work a regular daytime schedule.
Category 2: Possibly Exposed
A group of workers is put in this exposure category if they work:
- A regular evening schedule
- Split shift (two or more distinct periods each day)
- An irregular schedule (usually prearranged one week or more in advance)
- On call (no prearranged schedule)
- Other (some other type of shift not elsewhere noted)
Category 3: Exposed
A group of workers is put in this exposure category if they work:
- Regular night (graveyard) shifts
- Rotating shifts (changes from days to evenings to nights)
Underestimation of night shift work prevalence
Our estimates for Canadians’ exposure to night shift work have a few important considerations. They fall into two themes:
- Different surveys used by CAREX have different numbers of people in the work force
- Missing data in the SLID 2011
Differing survey numbers
We did not use the Canadian Census (our usual CAREX Canada data source) to assess night shift work because there is no information in that survey about what time of day people work. The limitation of using a separate survey for our night shift work estimates is that the total population measured by each survey is slightly different due to differences in inclusion criteria and differences in study design and implementation.
In the 2011 SLID, there were 16.3 million employed people represented by the sampling strategy. In the 2011 Census data, however, there were approximately 16.6 million employed people. The 2011 Census estimates are based on a voluntary National Household Survey, and not the long-form census. Similar differences can be observed with the 2006 estimates, where more employed people were represented in the Census (16.9 million people) compared to the SLID (15.1 million people). We can therefore assume that our night shift work estimates could be missing some people who are exposed, and thus are an underestimate of the true population exposed.
Missing data in the SLID
There is missing data in the SLID that makes defining the population to use for our estimates more difficult. Many people did not provide a classifiable answer to the questions on job title, industry, province, or shift type worked. This impacts the ways in which we can report exposure by any of these dimensions.
To show this, we defined the different potential ‘universes’ of data by showing how each missing response limits the number of people able to be classified in Table 1. Firstly for this work, we cannot use any data from those employed people who did not have a shift schedule reported (n=68,700). It is likely that some of these people are night shift workers and we cannot account for these missing data. Among those that do have a shift schedule reported, Table 1 shows how the population changes (both in total and also by exposure level for night shift work) depending on how complete we require the data to be. Note that data on sex was complete in the SLID (all reported either male or female).
As this data shows, the difference between the lower and upper estimate of the size of each group is 4-5%, and so does not impact our estimates substantially. Because of this, we used only data for those people who had complete data for all variables of interest (shift type, sex, province, industry, and occupation; n = 15.2 million workers) so that our estimates remain consistent no matter which dimension is examined. Users of this data should consider our estimates for night shift work prevalence as conservative, and note that the total number of Canadians doing night shift work could be slightly higher.
Finally, the survey did not include respondents from the Territories, which resulted in these workers not being included in our estimates. If we assume that the national average percentage by shift type also applies to the Yukon, Northwest Territories, and Nunavut, then we are also missing approximately 7,300 workers in our total estimate.
Table 1: How the population choice in the SLID impacts the estimated number of people exposed
| Definition of population | Exposed1 | Possibly Exposed2 | Unexposed3 | Total Population |
|---|---|---|---|---|
| Complete data on shift type | 1,834,000 | 3,544,000 | 10,622,000 | 16,001,000 |
| Complete data on shift type and province | 1,829,000 | 3,509,000 | 10,505,000 | 15,843,000 |
| Complete data on shift type, province, and industry | 1,819,000 | 3,466,000 | 10,404,000 | 15,689,000 |
| Complete data on shift type, province, industry, and occupation | 1,757,000 | 3,363,000 | 10,049,000 | 15,169,000 |
1. “Exposed” group includes those who work a regular night or graveyard shift, or a rotating shift
2. “Possibly Exposed” group includes those who work regular evenings, split shifts, on call, irregular shifts or other schedules
3. “Unexposed” group includes those who work a regular daytime shift.
Sources
Subscribe to our newsletters
The CAREX Canada team offers two regular newsletters: the biannual e-Bulletin summarizing information on upcoming webinars, new publications, and updates to estimates and tools; and the monthly Carcinogens in the News, a digest of media articles, government reports, and academic literature related to the carcinogens we’ve classified as important for surveillance in Canada. Sign up for one or both of these newsletters below.
CAREX Canada
School of Population and Public Health
University of British Columbia
Vancouver Campus
370A - 2206 East Mall
Vancouver, BC V6T 1Z3
CANADA

As a national organization, our work extends across borders into many Indigenous lands throughout Canada. We gratefully acknowledge that our host institution, the University of British Columbia Point Grey campus, is located on the traditional, ancestral, and unceded territories of the xʷməθkʷəy̓əm (Musqueam) people.