2,4-D Occupational Exposures

2,4-D Occupational Exposures
Overview
In occupational settings, 2,4-D can be absorbed via inhalation, oral, and dermal routes. Skin absorption, however, is the dominant source of occupational exposure, accounting for more than 90% of the total amount entering the body.[1]
CAREX Canada estimates that between 31,000 and 44,000 Canadian workers are exposed to 2,4-D in the agricultural sector. The majority of pesticides sold in Canada are used in agricultural (70% of active ingredients sold, by weight). For this reason, these exposure estimates focus on workers in the agricultural industry
READ MORE...
Workers in industries other than agriculture, including forestry, public utilities, and landscaping, may be at risk of exposure to 2,4-D.[2]
Prevalence Estimate
Results show that between 31,000 (11% of the agricultural working population, based on the Census of Population) and 44,000 Canadian workers (9% of the agricultural working population, based on the Census of Agriculture) are occupationally exposed to 2,4-D in the agricultural sector.†
The farm type with the largest number of exposed workers is “other grain farming”, which includes farms growing a combination of grains and oilseeds, followed by dairy cattle and milk production and fruit and tree nut farming. Dairy cattle and milk production, as well as beef cattle farms, have large numbers of exposed workers since these farms typically grow their own crops to feed the livestock.
†Note: A range of exposure estimates has been calculated using different labour force data sources. Please refer to the methods for more information. The results on this page that are not presented as a range represent the upper limit of the calculated estimates (based on the Census of Agriculture, unless otherwise stated).
Workers exposed to 2,4-D by industry in 2016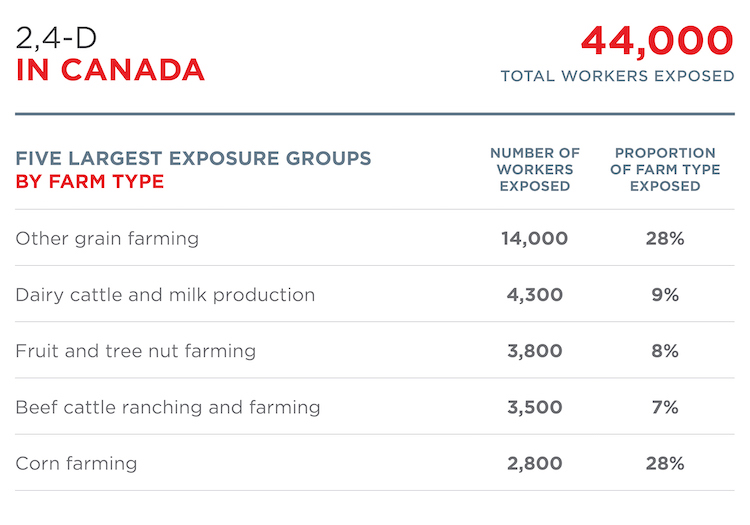
When examined by region, Manitoba, Alberta, Saskatchewan, and Ontario have higher per-capita exposure to 2,4-D than the national average (887 exposed workers per 10,000 workers), while British Columbia, Quebec, and the maritime provinces have lower per-capita exposure compared to the Canadian average. Ontario, Alberta, Quebec, and Saskatchewan have the highest total number of workers exposed to 2,4-D.
Workers exposed to 2,4-D by region in 2016
Click the second tab to view total number of workers exposed.
* Excluding the Territories
Likelihood of Exposure
In addition to the estimated 44,000 Canadians that are exposed to 2,4-D in their workplaces in the agricultural sector, 30,000 workers are probably exposed and 72,000 workers are possibly exposed. The majority of workers exposed to 2,4-D are in the possibly exposed category, highlighting the need for better data on workplace exposures to pesticides.
Workers exposed to 2,4-D by likelihood of exposure in 2016
Note: Total percentage may not add up to 100 due to rounding
Likelihood of exposure by industry
Identifying industries with higher numbers of workers exposed to 2,4-D can help to prioritize exposed groups and target exposure reduction resources more effectively.
The table below shows the number of workers exposed by industry group and likelihood of exposure to 2,4-D. These results highlight industries with the greatest number of workers, as well as the industries with the highest proportion of workers in the exposed category. Data is shown for those industry groups with at least 1,000 people in the exposed category. Depending on the goals of an exposure reduction campaign, reducing exposure in the largest group might be a useful strategy, or reducing exposure among those most likely to be exposed could be seen as a priority.
Workers exposed to 2,4-D by likelihood of exposure and industry in 2016
* This group specifically includes occupations that were not captured by the Census of Agriculture (e.g. contract workers), across all farm types.
Methods and Data
Data sources
Data used in developing the occupational estimates for 2,4-D were collected from several sources:
- The Census of Agriculture collects detailed information about Canada’s agricultural industry, and its farm operators and families (excluding contract workers). It surveys all farm operators in Canada. For our 2,4-D exposure estimates, we used data from 2016.
- The National Agricultural Workers Survey (NAWS) is an employment based, random sample survey of crop workers in the United States that monitors employment and demographic characteristics of hired crop workers. For our estimate, we use data from 2002 to 2016, for the Midwest and Northwest states.
- Canadian and US scientific peer reviewed publications that addressed pesticide exposure in Canada and the United States.
- Grey literature including technical reports from governments and international bodies.
Prevalence Estimate Method
Methods were developed with input from a Pesticides Advisory Committee (PAC). The PAC comprised experts from Canada and the United States in exposure assessment, occupational epidemiology, and geography. The finalized methods yield estimates of the number (and proportion) of exposed agricultural workers by industry (North American Industry Classification System, NAICS) and province.
Two estimates were calculated – one based on the 2016 Census of Population and one based on the Census of Agriculture. The Census of Population and Census of Agriculture survey the working population differently and as a result, the number of agricultural workers captured by the two surveys differs. The Census of Population only collects information on an individual’s main job, and as a result may not include part-time workers, seasonal workers, or temporary workers. The Census of Agriculture collects data on all farm operators and hired agricultural workers (excluding contract workers), regardless of their employment status. For this reason, the Census of Population-based results represent a lower estimate of exposure, while the Census of Agriculture-based results represent an upper estimate of exposure.
Generally, the methods can be broken down into four steps. First, we estimated the number of workers that would fall into each NAICS farm type. For the lower estimates (based on the Census of Population), we applied the distribution of workers by farm type from the Census of Agriculture to labour force data from the Census of Population. The Census of Agriculture collects information about hired labour (and not contract workers) for specific industries; only these workers were pulled from the Census of Population and incorporated in this first calculation. For the estimates based on the Census of Agriculture, we directly extracted data on the number of workers by NAICS farm type.
Second, we multiplied the proportion of farms applying “herbicides” by the total number of workers (by farm type) to identify workers at risk of exposure. This calculation was only completed for farm types that describe crops for which 2,4-D is registered (e.g. wheat farms).
Third, we assigned likelihood of exposure (i.e. exposed, probably exposed, possibly exposed) to these workers using the methods described in the following section.
Finally, to complete the agricultural estimates, we added workers that are not captured by the Census of Agriculture (e.g. contract workers within the agricultural industry) but are at risk of exposure. These workers were identified using the Census of Population, and their prevalence and likelihood of exposure were assessed independently using CAREX Canada’s occupational approach. Because the Census of Population has less detailed labour force data than the Census of Agriculture, results are summarized for higher-level sectors (e.g. for “crop production”) instead of for specific farm types.
Exposure Likelihood Method
Workers who were identified as being at risk of exposure were qualitatively assigned exposure likelihood (i.e. exposed, probably exposed, and possibly exposed) using information on crop type, primary tasks, application methods, crop production practices, and the propensity with which pesticide residues transfer from crop foliage to skin upon contact.
The primary route of occupational exposure to pesticides is through the skin; thus, tasks with increased potential for dermal contact were ranked as more likely to lead to exposure. All workers who reported applying, mixing, or loading pesticides in the past 12 months were considered exposed, while workers completing tasks that would bring them into contact with treated crops were considered probably exposed. All remaining workers were considered possibly exposed.
Category 1: Possibly exposed
- A group of workers is put into this category if they have been identified as at risk of exposure but do not fall under Category 2 or 3
Category 2: Probably exposed
- A group of workers is put into this category if their primary task may lead to dermal contact with treated crops
Category 3: Exposed
- A group of workers is put into this category if they are involved with loading, mixing, or applying pesticides
Interpretation of the results and limitations
Both estimates (those based on the Census of Agriculture and the Census of Population) assume that if a specific farm type (e.g. wheat farms) applies herbicides and 2,4-D is registered for use on the crop, that 2,4-D is indeed applied. In actuality, there are multiple pesticide products registered for use on a single crop. Typically, farmers will choose just one or sometimes several products to apply to the crop. While we cannot assess the impact of this assumption due to limited data on 2,4-D application rate by crop in Canada, 2,4-D is a commonly used pesticide and the estimates are not expected to be significantly over-estimated.
We have assumed that farm types only grow the crops that they describe (e.g., that soybean farms only grow soybeans). However, farm types are classified based on the predominant type of production (the crop, or crop type, that contributes most to the estimated receipts). By assuming that farm types are restricted to growing crops described by their classification, the total number of workers exposed may be underestimated. The degree to which this occurs is not likely to be quantifiable due to limited data on the types of crops grown together on specific NAICS farm types.
Sources
Subscribe to our newsletters
The CAREX Canada team offers two regular newsletters: the biannual e-Bulletin summarizing information on upcoming webinars, new publications, and updates to estimates and tools; and the monthly Carcinogens in the News, a digest of media articles, government reports, and academic literature related to the carcinogens we’ve classified as important for surveillance in Canada. Sign up for one or both of these newsletters below.
CAREX Canada
School of Population and Public Health
University of British Columbia
Vancouver Campus
370A - 2206 East Mall
Vancouver, BC V6T 1Z3
CANADA

As a national organization, our work extends across borders into many Indigenous lands throughout Canada. We gratefully acknowledge that our host institution, the University of British Columbia Point Grey campus, is located on the traditional, ancestral, and unceded territories of the xʷməθkʷəy̓əm (Musqueam) people.