2,4-D Environmental Exposures

2,4-D Environmental Exposures
Overview
The general population is exposed to 2,4-D by ingesting residues in food products or water, inhaling the product during application or drift, and directly contacting dust.[1,2,3]
CAREX Canada estimates that over 2 million people in Canada live in areas where the potential for exposure to 2,4-D is higher than other areas in the country based on their residential proximity to agricultural areas, which amounts to about 6% of the Canadian population. Since people residing near agricultural land may have higher pesticide exposures than those who live in non-agricultural areas due to the geographical proximity to areas with high pesticide usage, these estimates focus on community exposure related to agricultural pesticide use.[4,5] In addition, data availability for other routes of exposure (e.g. diet, domestic application) are limited.
READ MORE...
As expected, exposure varies based on agricultural activity and the types of crops grown. Potential for exposure to 2,4-D is much higher in areas where cereal crops, potatoes, and fruit are more commonly grown due to the higher application rates for these crops. The prairie provinces (Alberta, Saskatchewan, Manitoba), Prince Edward Island and Southern Quebec all had higher potential for exposure to 2,4-D than other areas. These estimates primarily consider exposure through inhalation, which is a more immediate form of exposure, but pesticides can also seep into ground water and soil and lead to subsequent exposure. The CAREX Canada estimates do not account for dietary ingestion, which is a major route of pesticide exposure, especially for young children.[6]
In addition to those living near agricultural areas, the spouses and children of pesticide applicators are more likely to be exposed (termed para-occupational exposure) compared to the general population.[7] This is because 2,4-D may be brought into homes on the bottom of shoes, increasing potential for exposure especially in young children through dermal means and hand to mouth transfer.[8] This is an important exposure route for young children because they spend the majority of their time indoors, and because 2,4-D persists longer indoors than outdoors.[8] In children younger than 3 years of age, non-dietary exposure to 2,4-D accounted for 15% of total exposure.[9]
In the Canadian prairies, 2,4-D is the most frequently detected herbicide in rainfall; it is present in up to 93% of samples collected.[10] 2,4-D may enter the atmosphere when it volatilizes during and after spray applications, when drops of 2,4-D are transported by wind currents after spraying, and when 2,4-D adheres to dust and is incorporated in clouds during the cloud forming process.[11]
Mapping Potential Exposure
Pesticide usage for all crops in Canada were used to estimate the total amount of 2,4-D applied to crops, which indicates potential exposure for people living in nearby areas. Actual pesticide application rates were not available for Canada, so pesticide usage was estimated based on crop types grown and typical application rates for these crops in North America.
Results show that 2,4-D exposure is potentially much higher in areas where cereal crops, potatoes, and fruit are more commonly grown due to higher application rates. The prairie provinces (Alberta, Saskatchewan, and Manitoba), Prince Edward Island, and Southern Quebec have higher potential for exposure to 2,4-D than other areas in Canada.
2,4-D usage in Canada based on all available agricultural crops, 2016†

* Estimated agricultural application rates of less than 0.2 kg/km2 are classified as no exposure
Potential Number of People Exposed
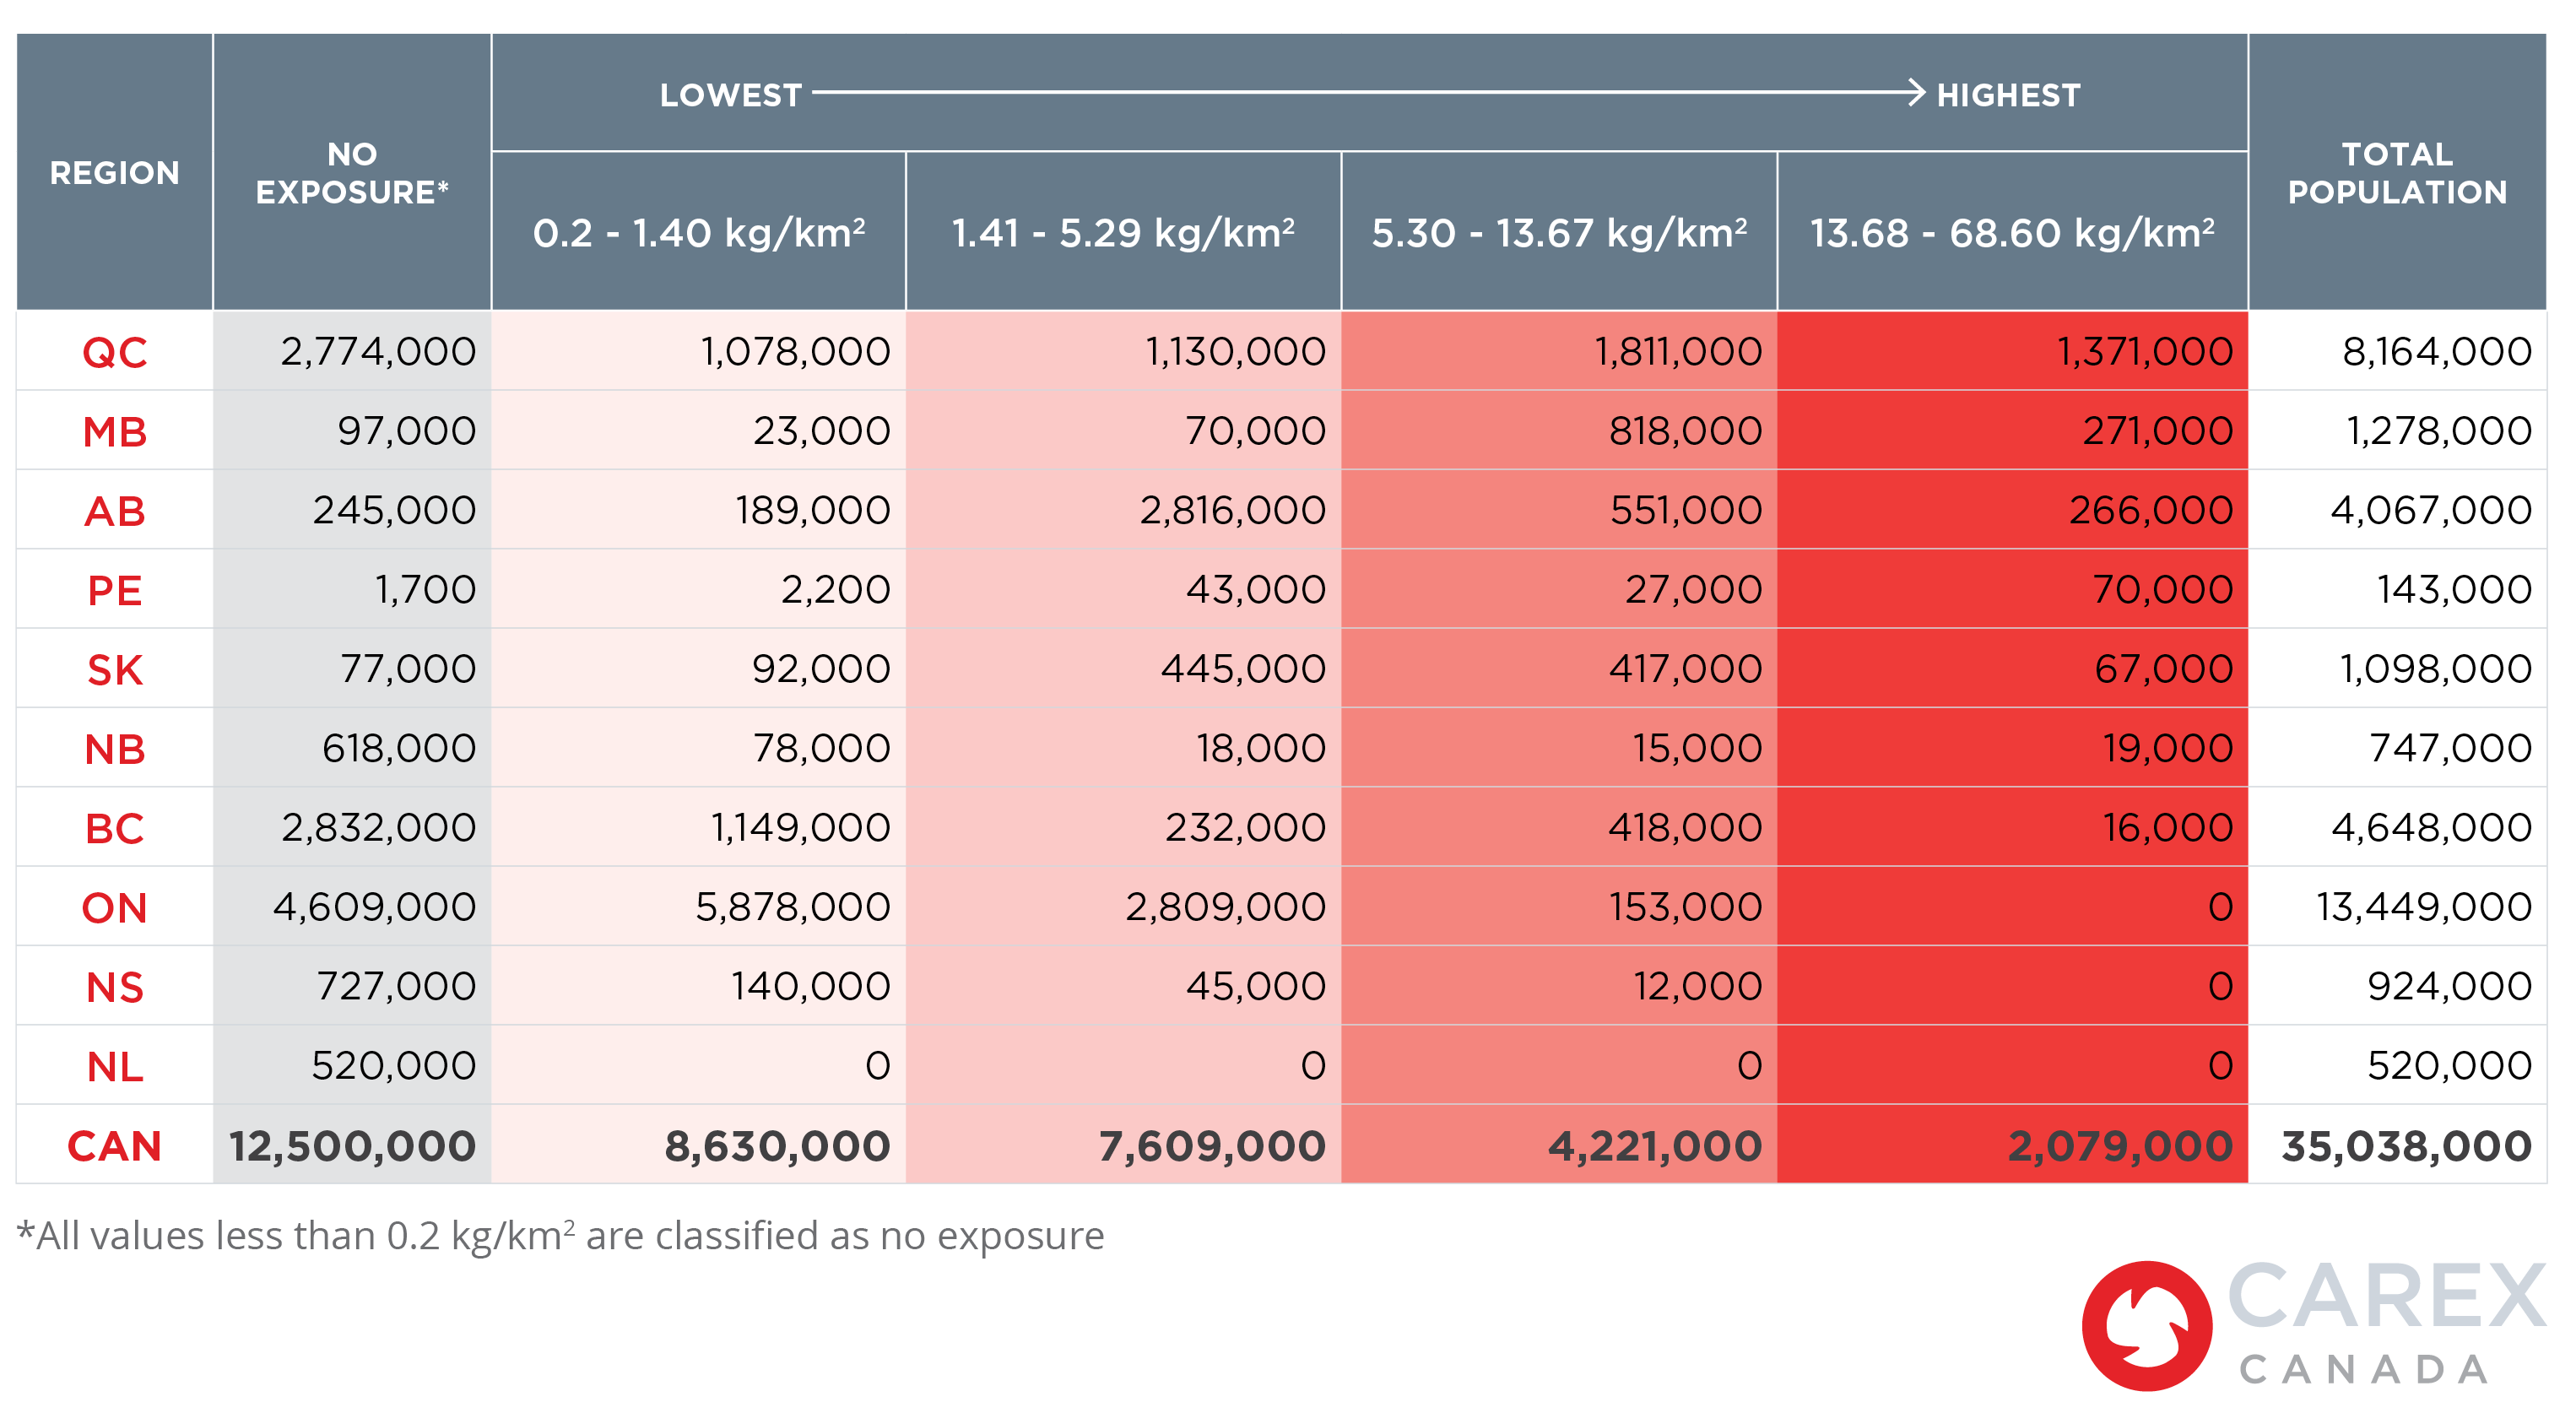
Over 2 million people in Canada live in areas where the potential for exposure to 2,4-D is higher than other areas in the country. As displayed in the figures below, exposure levels vary by province, mostly due to differences in agricultural activity and population densities. More people are likely to be exposed in agricultural areas with high population density, while areas with intensive agricultural activity and lower population density will see relatively lower numbers but a higher percentage of their population exposed. For example, in Prince Edward Island nearly half of the province’s population are in the highest potential exposure category, but the total number of people (70,000) is lower compared to other provinces.
Percent of people potentially exposed to 2,4-D based on application rates (kg/km2) by province, 2016†
* Estimated agricultural application rates of less than 0.2 kg/km2 are classified as no exposure
On the other hand, the highest population densities near agricultural areas are found in Quebec, which has the largest number of people with the highest potential for 2,4-D exposure (1,371,000 people).
Number of people potentially exposed to 2,4-D based on application rates (kg/km2) by province, 2016†
†Note: Results illustrate 2,4-D application rates in kilograms per square kilometre (kg/km2) for each Census Sub-Division (CSD) in Canada (n=5,054). Data were mapped in quartiles to show variations in application rates across the country and do not represent an associated risk or exposure limit. The potential for exposure is higher in areas with higher application rates, but this does not necessarily indicate that exposure has occurred.
Methods and Data
Data sources
Actual pesticide application rates were not available for Canada, so pesticide usage was estimated based on crop types grown and typical application rates for these crops in North America. Data were obtained on the distribution and acreage of different crop types, 2,4-D application rates, and the number of people living in each area. Data on agricultural crops were obtained from Agriculture and Agri-Food Canada’s Annual Crop Inventory for 2016, which are digital images (raster datasets) that produce an average crop accuracy of 89%.
Data on pesticide usage came from the United States Department of Agriculture’s Agricultural Chemical Use Program and the Government of Ontario’s Ministry of Agricultural, Food and Rural Affairs. These datasets summarize how much 2,4-D was applied to crops along with the average yearly application rates. Group averages were applied if specific crop data were not available. For instance, we averaged the 2,4-D application rates for pears, peaches, and apples to estimate the application rate for “orchard fruits”, which was a crop type captured by the Annual Crop Inventory. Average annual 2,4-D application rates for all crops were obtained.
Population data from Canada’s 2016 Census of Population were used to estimate the number of people potentially exposed. Population estimates are based on the number of people living within the census subdivision (CSD).
Methods and analysis
Estimates were calculated at the CSD level (n=5,054). Specifically, we calculated the total area (in km2) of land within each CSD for each crop type. Total areas were then multiplied by the average 2,4-D application rate data for each crop. Finally, the total was summed together to obtain an estimate of 2,4-D use in kilograms for each CSD. Results were weighted in square kilometres to illustrate the kilograms of 2,4-D applied per square kilometre in each CSD. CSDs with less than 0.2 kg/km2 were classified as having no exposure to account for very small agricultural activity within the CSD. Data are presented in quartiles and integrated with population data to show potential exposure and variations across the country.
Sources
Subscribe to our newsletters
The CAREX Canada team offers two regular newsletters: the biannual e-Bulletin summarizing information on upcoming webinars, new publications, and updates to estimates and tools; and the monthly Carcinogens in the News, a digest of media articles, government reports, and academic literature related to the carcinogens we’ve classified as important for surveillance in Canada. Sign up for one or both of these newsletters below.
CAREX Canada
School of Population and Public Health
University of British Columbia
Vancouver Campus
370A - 2206 East Mall
Vancouver, BC V6T 1Z3
CANADA

As a national organization, our work extends across borders into many Indigenous lands throughout Canada. We gratefully acknowledge that our host institution, the University of British Columbia Point Grey campus, is located on the traditional, ancestral, and unceded territories of the xʷməθkʷəy̓əm (Musqueam) people.