Glyphosate Environmental Exposures

Glyphosate Environmental Exposures
Overview
The general population is exposed to glyphosate through their diet, domestic application, direct skin contact, or inhalation during pesticide application.[1,2] Glyphosate mists can contaminate air and soil as they are applied and transported into neighbouring residential areas by the wind.[3,4]
CAREX Canada estimates that over 2 million people in Canada live in areas where the potential for exposure to glyphosate is higher than other areas in the country, which amounts to about 6% of the Canadian population. Since people residing near agricultural land may have higher pesticide exposures than those who live in non-agricultural areas due to the geographical proximity to areas with high pesticide usage, these estimates focus on community exposure related to agricultural pesticide use.[5,6] In addition, data availability for other routes of exposure (e.g. diet, domestic application) are limited.
READ MORE...
As expected, exposure varies based on agricultural activity and the types of crops grown. Quebec had the largest number of people with higher potential for exposure (1.31 million people). Manitoba and Saskatchewan also had above average potential exposure for a large proportion of their population. As expected, provinces or areas were agriculture is less intensive have much lower estimated exposures.
In the environment, glyphosate binds tightly to soil, where it is eventually broken down by microbes. The half-life of glyphosate in the soil is an average of 47 days, but varies greatly depending on local conditions.[7] Glyphosate is considered low risk of contaminating groundwater due to its strong absorptive properties; however it can contaminate surface waters through aquatic use (i.e. where it is applied to control aquatic weeds), spills, and soil erosion.[8,9]
A Canadian National Water Quality Surveillance Program conducted in 2003-2005 found concentrations of glyphosate as high as 9,000 nanograms per litre (ng/L) in runoff water and 13,000 ng/L in surface water in the Lower Fraser Valley in BC.[10] These levels are well below the maximum allowable concentration (MAC) for the Guidelines for Canadian Drinking Water Quality of 280,000 ng/L and the Canadian Council of Ministers for the Environment (CCME) Water Quality Guideline of 65,000 ng/L. Glyphosate was not detected in appreciable amounts in any of the other provinces tested.[10]
Mapping Potential Exposure
Pesticide usage for all crops in Canada were used to estimate the total amount of glyphosate applied to crops, which indicates potential exposure for people living in nearby areas. Actual pesticide application rates were not available for Canada, so pesticide usage was estimated based on crop types grown and typical application rates for these crops in North America.
Results show that glyphosate exposure is potentially much higher in areas where crops such as canola, wheat, corn, and soybeans are more commonly grown due to higher application rates for these crops. The prairie provinces (Alberta, Saskatchewan, and Manitoba), along with parts of Southern Quebec all have higher potential for exposure to glyphosate than other areas of the country.
Glyphosate usage in Canada based on all available agricultural crops, 2016†

* Estimated agricultural application rates of less than 0.2 kg/km2 are classified as no exposure
Potential Number of People Exposed
Over 2 million people in Canada live in areas where the potential for exposure to glyphosate is higher than other areas in the country, which amounts to about 6% of the Canadian population. As displayed in the figures below, exposure levels vary by province, mostly due to differences in agricultural activity and population densities. More people are likely to be exposed in agricultural areas with high population density, while areas with intensive agricultural activity and lower population density will see relatively lower numbers but a higher percentage of their population exposed. For example, Saskatchewan and Manitoba have the highest percentage of their population living in areas with above average potential for exposure (76% and 85%, respectively, in the highest two categories), but most of this exposure is not in the highest category. As expected, regions where agriculture is less intensive have much lower estimated potential exposures.
Percent of people potentially exposed to glyphosate based on application rates (kg/km2) by province, 2016†
* Estimated agricultural application rates of less than 0.2 kg/km2 are classified as no exposure
On the other hand, Quebec has the largest number of people living in areas with the highest potential for exposure (1,312,000 people).
Number of people potentially exposed to glyphosate based on application rates (kg/km2) by province, 2016†
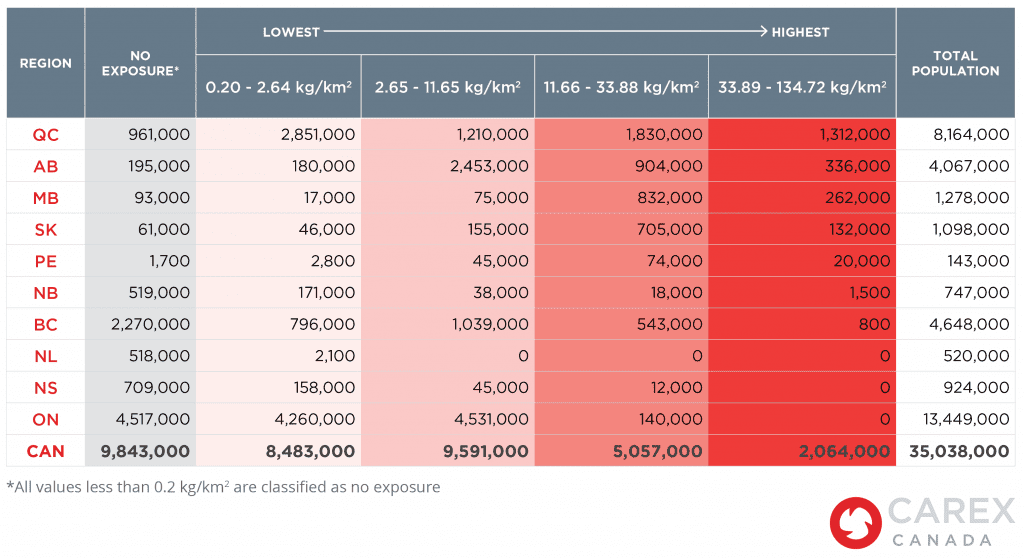
†Note: Results illustrate glyphosate application rates in kilograms per square kilometre (kg/km2) for each Census Sub-Division (CSD) in Canada (n=5,054). Data are presented in quartiles to show potential exposure and variation across the country. Data were mapped in quartiles to show variations in application rates across the country and do not represent an associated risk or exposure limit. The potential for exposure is higher in areas with higher application rates, but this does not necessarily indicate that exposure has occurred.
Methods and Data
Data sources
Actual pesticide application rates were not available for Canada, so pesticide usage was estimated based on crop types grown and typical application rates for these crops in North America. Data were obtained on the distribution and acreage of different crop types, glyphosate application rates, and the number of people living in each area. Data on agricultural crops were obtained from Agriculture and Agri-Food Canada’s Annual Crop Inventory for 2016, which are digital images (raster datasets) that produce an average crop accuracy of 89%.
Data on pesticide usage came from the United States Department of Agriculture’s Agricultural Chemical Use Program and the Government of Ontario’s Ministry of Agricultural, Food and Rural Affairs. These datasets summarize how much glyphosate was applied to crops along with the average yearly application rates. Group averages were applied if specific crop data were not available. For instance, we averaged the glyphosate application rates for pears, peaches, and apples to estimate the application rate for “orchard fruits”, which was a crop type captured by the Annual Crop Inventory. Average annual glyphosate application rates for all crops were obtained.
For canola, where different strands are grown with or without glyphosate application, exposure rates were estimated based on the proportion of each strand grown in that particular province. For instance, in Quebec, approximately 50% of the canola grown is glyphosate ready, while 50% has no glyphosate applied. For Quebec, an application rate of 50% of glyphosate was applied to canola (i.e., if canola has a glyphosate application rate of 146 kg/km2, in Quebec the rate would be 73 kg/km2 or 50% of the actual rate).
Population data from Canada’s 2016 Census of Population were used to estimate the number of people potentially exposed. Population estimates are based on the number of people living within the census subdivision (CSD).
Methods and analysis
Estimates were calculated at the CSD level (n=5,054). Specifically, we calculated the total area (in km2) of land within each CSD for each crop type. Total areas were then multiplied by the average glyphosate application rate data for each crop. Finally, the total was summed together to obtain an estimate of glyphosate use in kilograms for each CSD. Results were weighted in square kilometres to illustrate the kilograms of glyphosate applied per square kilometre in each CSD. CSDs with less than 0.2 kg/km2 were classified as having no exposure to account for very small agricultural activity within the CSD. Data are presented in quartiles and integrated with population data to show potential exposure and variations across the country.
Sources
Subscribe to our newsletters
The CAREX Canada team offers two regular newsletters: the biannual e-Bulletin summarizing information on upcoming webinars, new publications, and updates to estimates and tools; and the monthly Carcinogens in the News, a digest of media articles, government reports, and academic literature related to the carcinogens we’ve classified as important for surveillance in Canada. Sign up for one or both of these newsletters below.
CAREX Canada
School of Population and Public Health
University of British Columbia
Vancouver Campus
370A - 2206 East Mall
Vancouver, BC V6T 1Z3
CANADA

As a national organization, our work extends across borders into many Indigenous lands throughout Canada. We gratefully acknowledge that our host institution, the University of British Columbia Point Grey campus, is located on the traditional, ancestral, and unceded territories of the xʷməθkʷəy̓əm (Musqueam) people.